Data as the Compass of Transformation
How financial insights, digital analytics, and AI are reshaping the way enterprises create value.
Add bookmark
From Compliance to Advantage
Data can be interpreted in a multitude of ways, for example, take for example the evolving conversation of how organizations and individuals are trying to make sense of Artificial Generative Intelligence. In one of the most-read HBR articles of 2025, Marc Zao-Sanders observed that people are no longer using AI tools over and over for technical support such as editing, coding, or troubleshooting. That was the case in 2024, but now, based on research, users in 2025 are increasingly using AI for a different kind of human-centered purposes. Therapy and companionship rose to the top as use cases were observed, and new ways to use them appeared, such as organizing life and even finding purpose. The shift from technical efficiency to emotional and personal growth is a good tale about how comprehensive data can be used, when loaded, transformed, and made actionable, which becomes more than just information but context, guidance, and even meaning. In simple terms, data shows that people are moving from asking AI to fix tasks to asking it to help navigate lives.
Decoding Finance
Inside Hewlett-Packard, more than a decade earlier, I had the opportunity to find a similar lesson about how data can show more than what appears on a report. My role had evolved into financial analysis, focusing on analyzing a flabbergasting amount of numbers and outputs from Supply Chain and Channel Sales. There was a lot of my work was spent around Marketing Development Funds, reimbursements that HP was giving to partners, tied up to a complex process where both HP and Partners supported marketing campaigns. That was linked directly to sales incentives and contra-revenue, and I know that for anyone new to finance, those kinds of terms can feel like black magic. I had new acronyms in my life, like the infamous MEC, or “Month End Close”, an evolving process where every financial transaction of a given month is locked, reconciled, and reported by accountants. P&L refers to Profit and Loss, the statement that summarizes revenues, costs, and expenses, and reveals whether the
business is making a profit or not. Revenue is simply the money flowing in from sales, while contra-revenue is the money flowing out, in the form of discounts, rebates, or marketing incentives that reduce the headline sales figure. In practice, ten million dollars of product sales would look great, but after incentives and reimbursements, that would actually represent less of net revenue.
HP at a Crossroads
For me, supporting financial analysts across Europe, the Middle East, and Asia during Month End Close was my rite of passage, how I entered the hidden logic of corporate performance. That showed me how numbers connected across departments and geographies, how on earth a single discrepancy in a supplier rebate could ripple into an entire profit calculation, and how precision under dreadful pressure created trust in the enterprise’s financial narrative. The insane number of acronyms that once felt like barriers became entry points into a magic language, the kind that explained how organizations lived, breathed, and made decisions.
Looking back, the thing that made this period even more significant was the broader context. The Company was at a crossroads, the iPhone was a new product which had just been released by Apple, and the era of mobile computing was taking shape. BlackBerry, once the symbol of Wall Street traders and business mobility, was already in decline. Despite its scale, the Company I worked for missed the opportunity and all of a sudden was unable to compete meaningfully in smartphones, because it had invested so much in something strange that was a phone but not smart at all. The merger with Compaq had cemented HP’s position in PCs and printers, but margins on hardware were shrinking, and the real growth was in services and software. Because I was inside the finance team, which was already visible in the data we analyzed, revenue streams showed a clear contrast between the low margins of traditional hardware and the higher margins of services and enterprise solutions. All that Excel spreadsheets, statements, and reconciliations carried the early signals of a future in which HP would eventually break and split into four separate entities, each focused on more coherent lines of business. There were writings on the wall, but instead of reading the signs, we were watching executives making poor decisions until it was too late.
From Analysts to Algorithms
I am not a finance guru, but for me, that shows that data can’t be understood only as compliance or historical record. On one side, data ensures that auditors, regulators, and shareholders look at what’s going on and trust the integrity of financial statements. But from another side, that’s also a living compass that helps organizations navigate any uncertainty on the road ahead. Our Month End Close was always about accuracy, but served as a pattern recognition to see where incentives were eroding profitability, where regions were outperforming expectations, and where margins pointed to shifts in strategy. For me, this was a time to recognize information as a fantastic way to get perspective, both as a microscope and a telescope, zooming out to expose the smallest errors and at the same time zooming out to reveal the contours of the future.
Seen from today’s vantage point, we can trace a parallel with generative AI, just as financial analysts had to learn to interpret all those acronyms and statements, managers must learn to interpret signs, algorithms, and outputs. That’s an exercise of translating abstract concepts to real life: MEC, P&L, and contra-revenue were not self-explanatory, just as AI-generated recommendations are not self-justifying. Both instances require human judgment to understand and distinguish what is really a signal and what’s just noise. That’s something to reveal the value of data, because it is never just a matter of accumulating information, but also how to interpret that.
The Data Advantage
Given the right proportions, working as a financial analyst was also a lesson about different dimensions and scales. Supporting other analysts across EMEA meant reconciling differences in currency, tax treatment, and timing. A campaign in Germany might close at a different cadence than one in the Middle East, and the contra-revenue associated with each required careful allocation; things could be messed up because of human error, which was and is still prone to happen. That level of complexity mirrored the organizational reality, and you know that story: Here’s an enterprise global in scope, diverse in execution, and completely dependent on standardization to make the whole system intelligible. Data is a common language, but only if it is disciplined and curated; otherwise, financial reports risk can turn into noise and confusion, rather than bringing clear outcomes.
That kind of experience prepared me for much bigger transformations that I would witness in business services. Processes ensure consistency, but data gives those processes visibility, meaning, and tells not just if something happened in the past but the reason why that happened. We can, in theory, analyse trends and even see what comes next, without any crystal ball. In the magical kingdom of finance, that meant sometimes explaining not only the size of a rebate but its impact on margin, and an alternate version of the future where things didn’t work. We built scenarios, not only the timing of a payment but its implications for cash flow, which is also a great indicator of health in a company. For modern enterprises, that’s the time when the experts try explaining how an AI system generated its recommendation, and what assumptions underpinned its analysis, keeping in mind transparency in what they show and interpretation side by side.
For young professionals entering this world, the key is to demystify the terms and see them as tools rather than barriers. “MEC” is nothing more than closing the books so that the month can be frozen and analyzed. “P&L” is simply the story of how money came in and how it went out, with pluses and minuses. “Revenue” is the top line, “contra-revenue” is the discount that brings the figure closer to reality. These are not arcane codes bewitched by some wizard, but an example of the grammar of a company I worked for, and once I understood it really let me read the story that every other company I worked for told month by month, quarter by quarter.
The broader lesson is that data has both technical and human aspects, with processes and systems that can collect, reconcile, and analyze, but always requiring people to interpret, communicate, and act. Use it well, and it can reveal where strategy must change, as it did for HP in its recognition that services would outpace hardware. Sometimes, people making decisions use it poorly, so it becomes a distraction, a set of numbers that obscures rather than enlightens. The future of digital transformation depends on whether organizations can move beyond treating data as a passive record and instead embrace it as an active partner in decision-making.
Just as AI in 2025 is being asked to help people organize their lives or find purpose, data in the enterprise must do more than provide historical accuracy. That’s something that really must guide, contextualize, and illuminate the way. Data-driven enterprises must have leaders not only where they have always been but where they might go to have good things happening not only to the board and investors but to employees and society. Datasets can be transformed in the process, but the transformation itself is in the discipline of bringing insight and action. Once upon a time, that was the lesson in a finance team, and it probably remains something that others should do as organizations today grapple with the promises and perils of intelligent systems.
Continue your Digital Transformation journey...
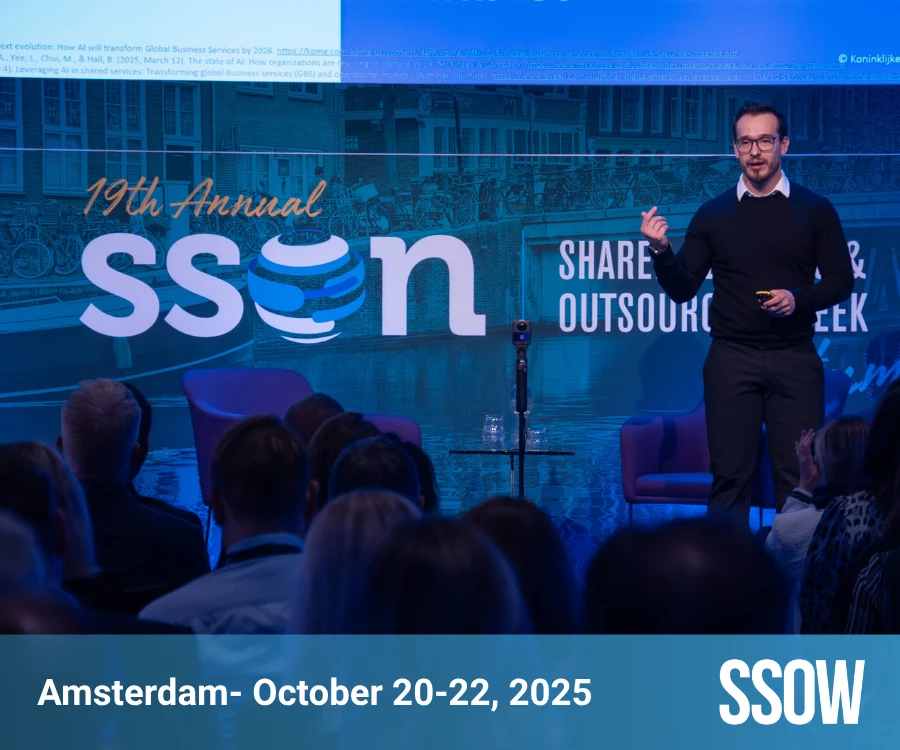
True transformation isn’t about tools - it’s about connection. The Digital Transformation Program at the 30th Annual Shared Services & Outsourcing Week conference (March 16–19, 2026, Orlando, FL) shows how AI, data, and automation are powering the next generation of shared services.
Learn More


